Google Ads VS Facebook Ads
By Two Minute Reports - April 20, 2022
Advertising (PPC)
![]()
![]()
For use with Looker Studio
License Type : Free with Two Minute Reports
About the Template
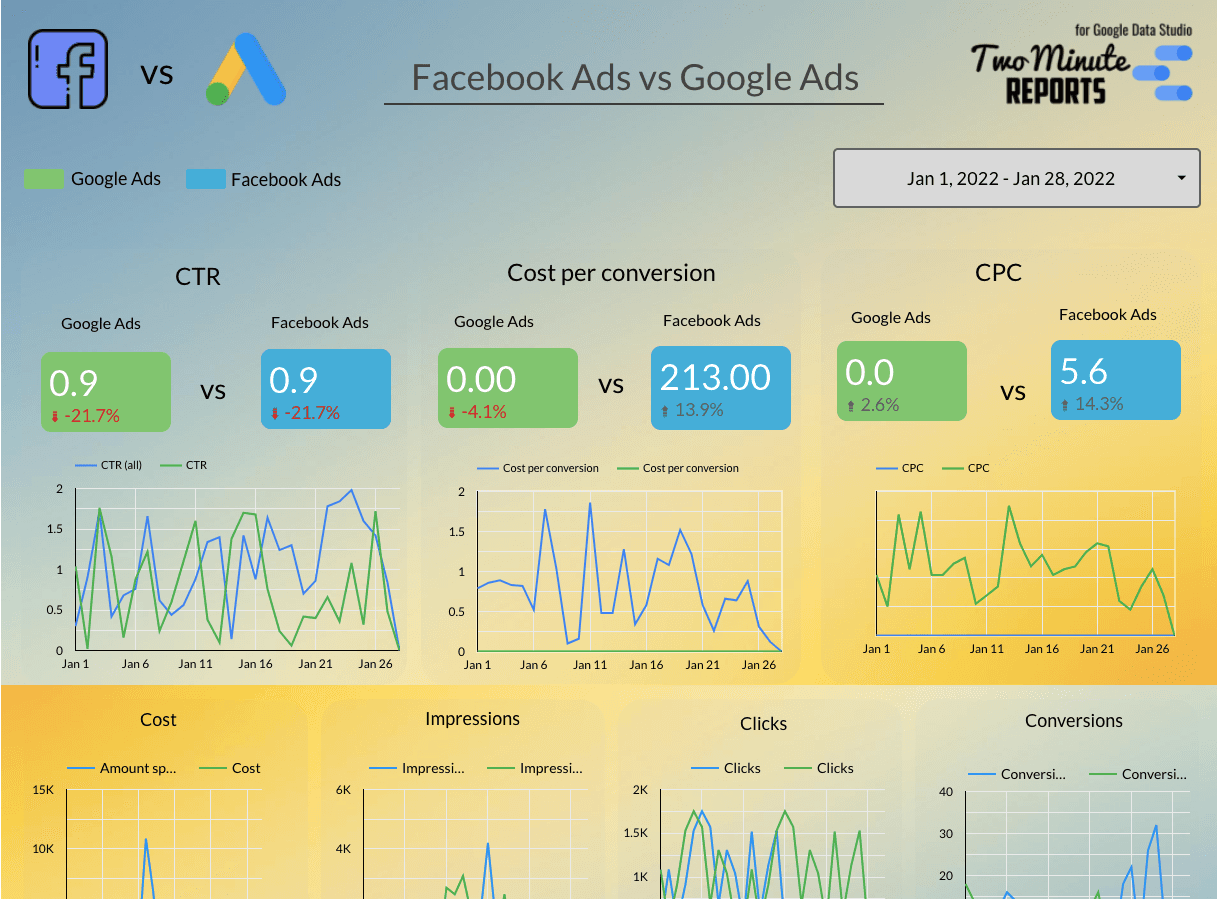
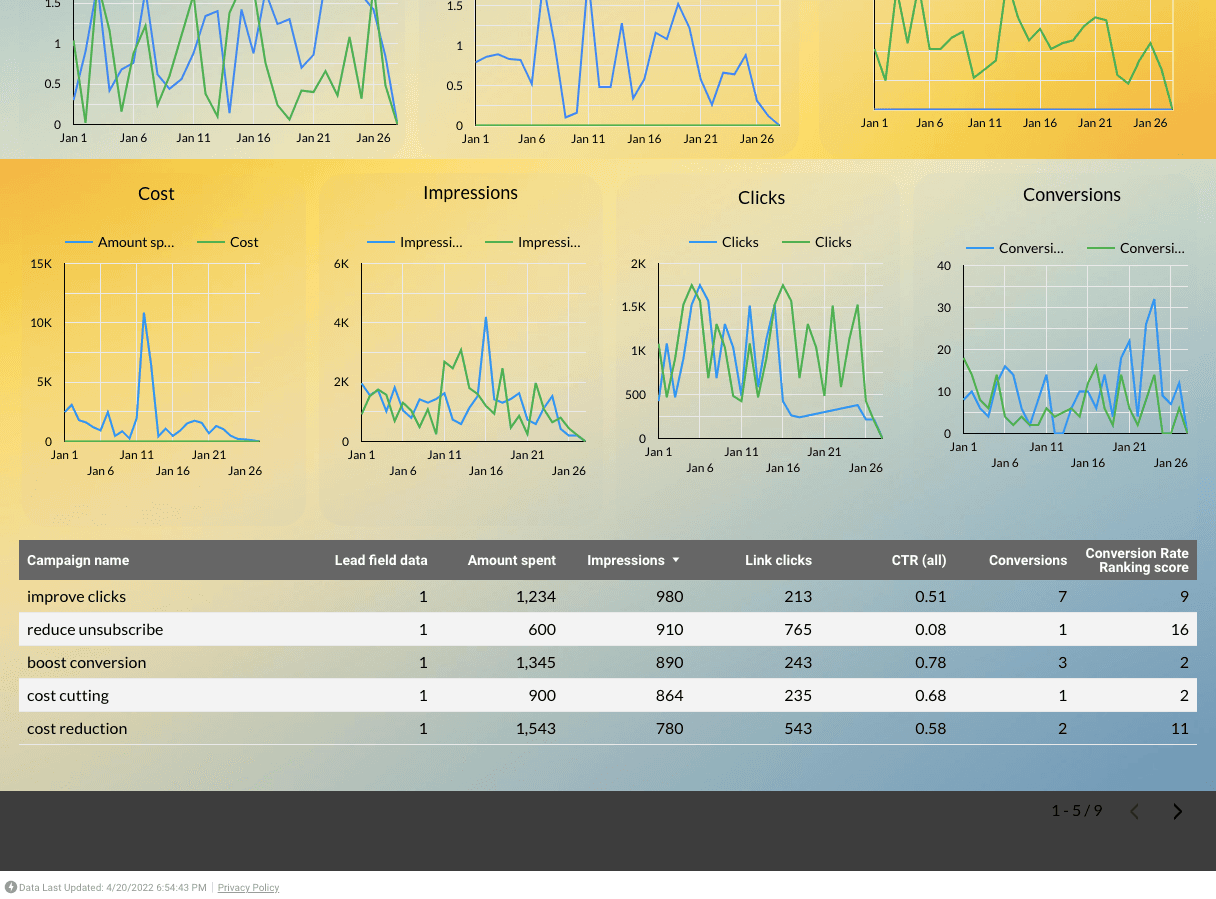
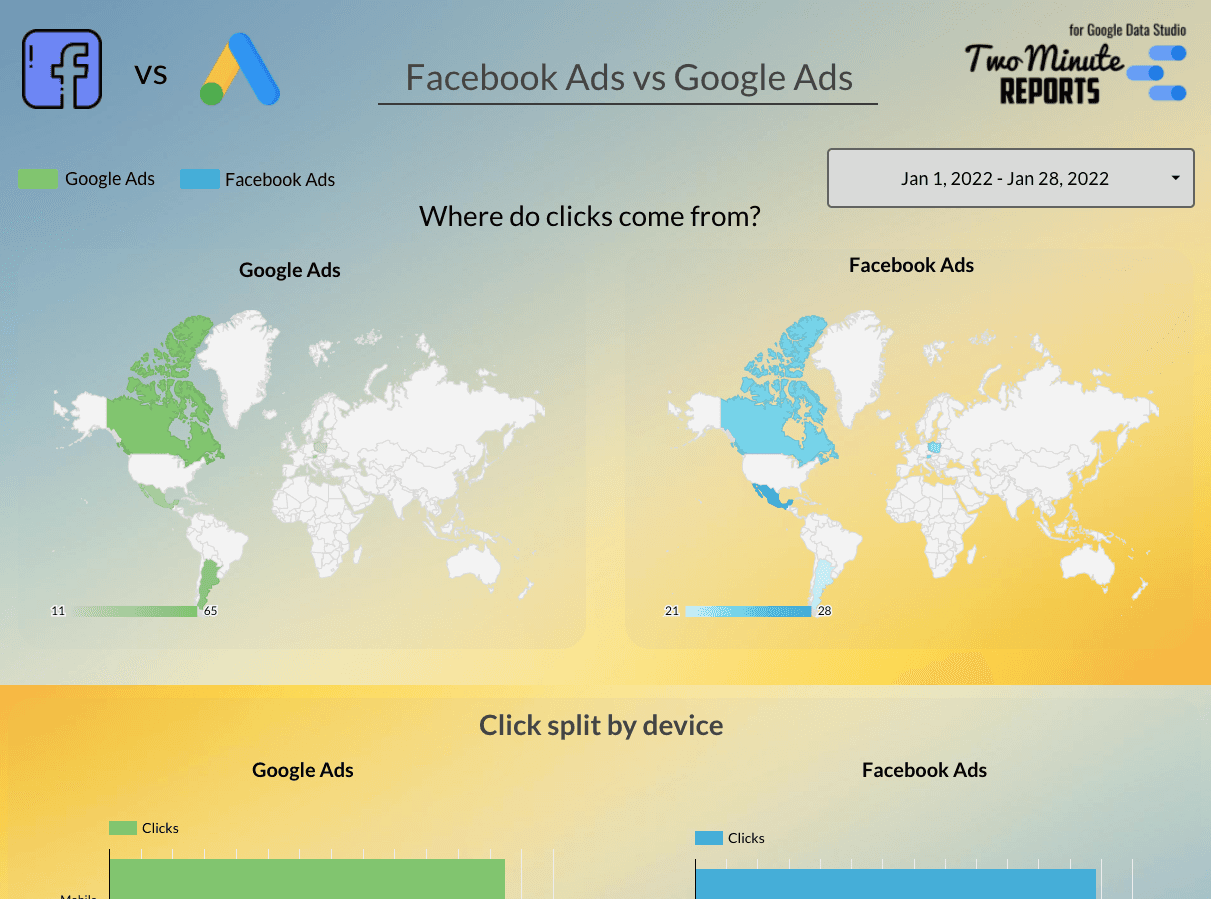
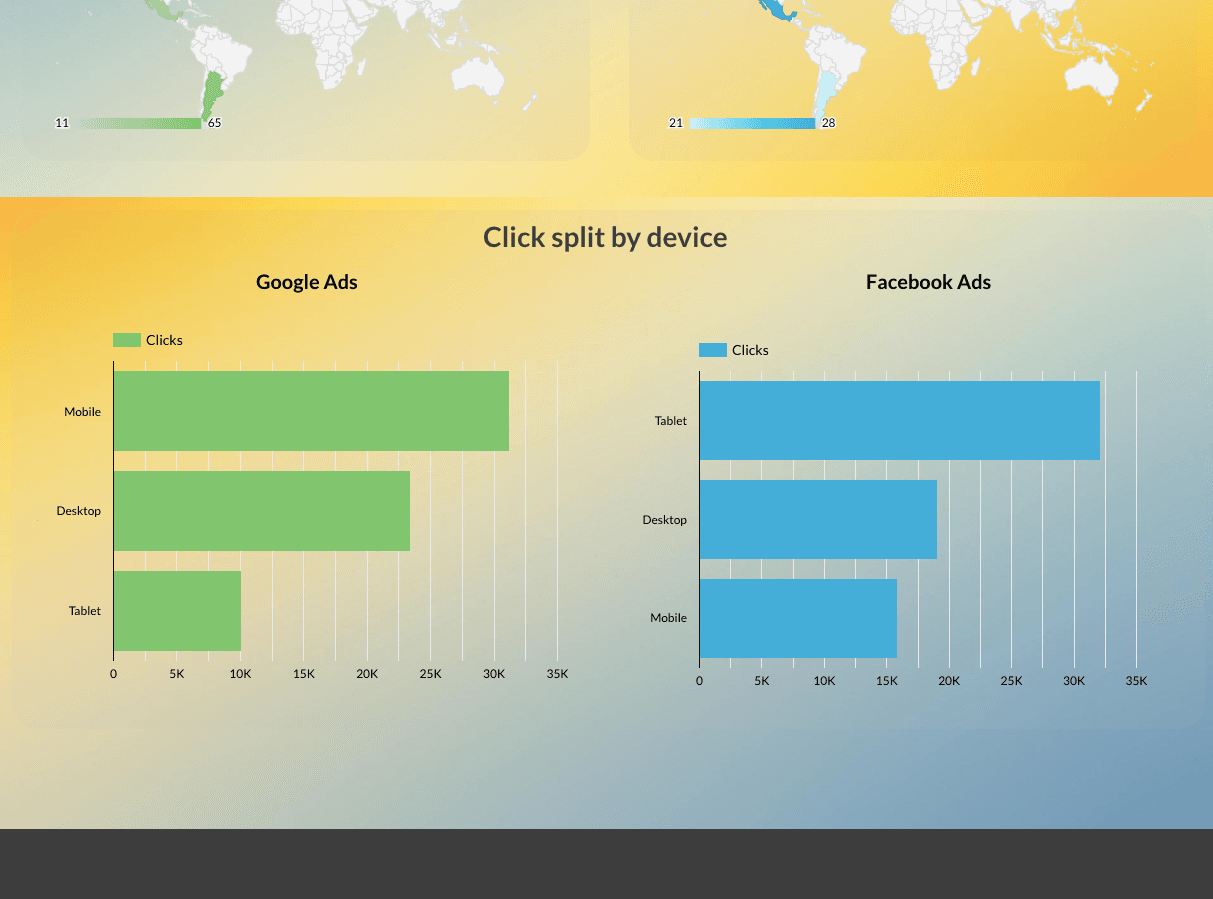
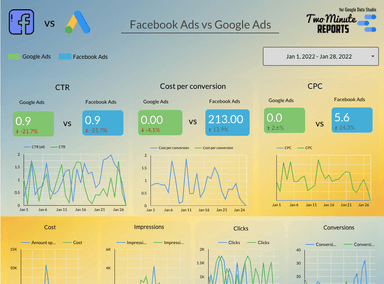
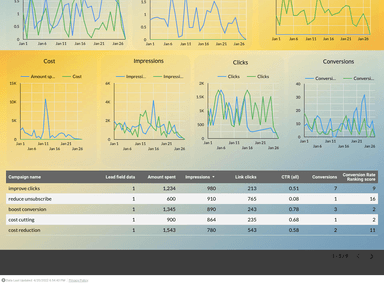
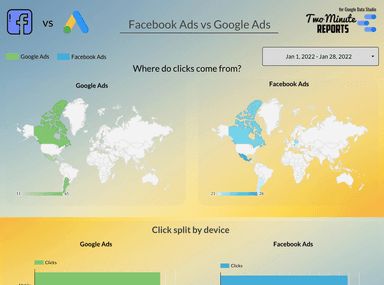
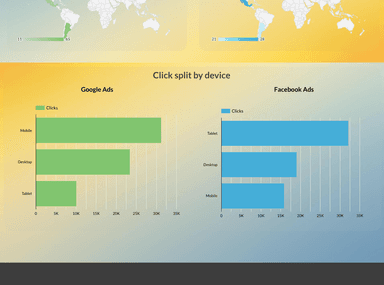
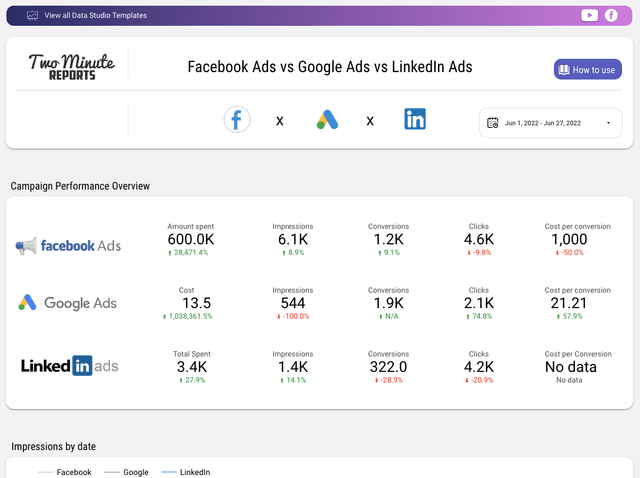
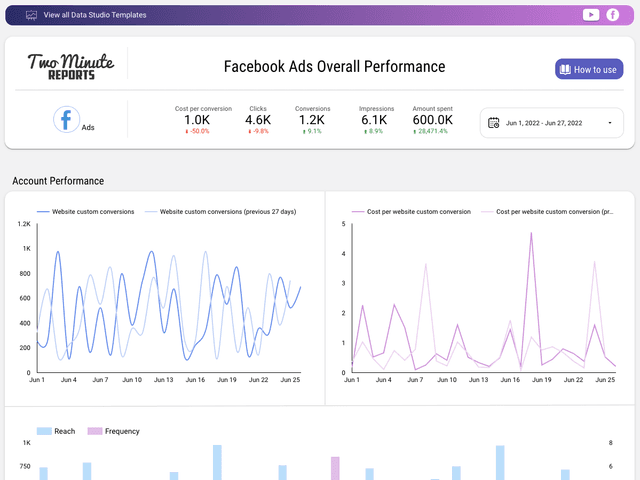
This is a comparative template on Google ads vs Facebook ads, in which the Key metrics like CTR, CPC, Cost per conversion, Cost, Impressions, clicks and conversions are compared using Graphs and scorecards. A dedicated table for campaign KPI's which consist of lead field date, amount spent, impressions, link clicks CTR, conversions and conversion ranking scores are measured. Get to know where your clicks are globally generated from, by accessing the GEO charts. Finally a bar graph for clicks which is split by device type. This Template would be an ideal solution for users using Facebook and Google ads regularly, as it is a short and a crisp Report. Click on the preview icon to have a look over it.
